I’ve previously written about how to make simple, print ready maps in R using library(maps). Unfortunately, the more recent versions the county database has some issues with relating FIPS codes to the correct county on the map. I’ve found that I had to roll back library(maps) to version 2.3-0 in order to get the county database to work as advertised. (FWIW, I haven’t had any issues with any of the other databases in the more recent versions.)
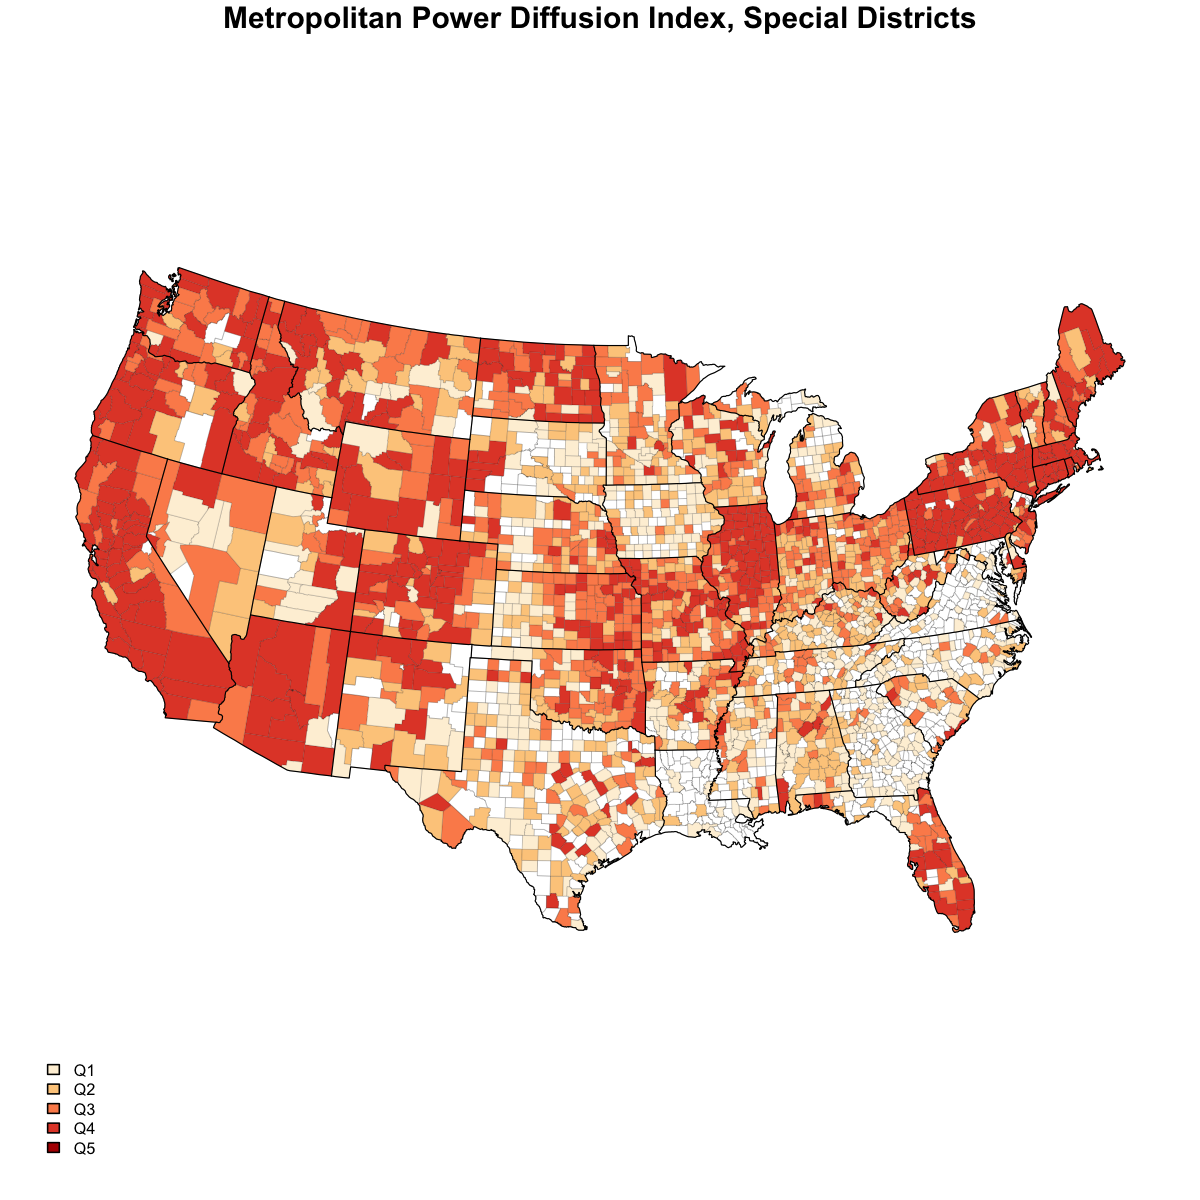
Since the original post is ancient, I’ve decided to update the code somewhat to make a better map. The code below creates a choropleth map of the Metropolitan Power Diffusion Index (MPDI) for special districts from year 2012. The base data comes from the 2012 Census of Governments. I’ll have a post on the MPDI and other measures of special district usage in a later post.
library(maps)
library(mapproj)
library(RColorBrewer)

nclr <- 5
plotclr.org <- brewer.pal(nclr, "OrRd")

mpdi <- read.table("mpdi.csv", header=TRUE, sep=",", stringsAsFactors=FALSE)

summary(mpdi)
mpdi.df <- data.frame(mpdi)
data(county.fips)
attach(mpdi.df)

mpdi$colorBuckets.mpdi <- as.numeric(cut(mpdi$mpdi, c(quantile(mpdi$mpdi, c(0.2,0.4,0.6,0.8,1)))))
mpdi.legend <- c("Q1", "Q2", "Q3", "Q4", "Q5")
mpdi.colormatched <- mpdi$colorBuckets.mpdi[match(county.fips$fips,mpdi$co_fips)]

par(mar=c(1, 1, 1, 1) + 0.1)
map(database="county", col=plotclr.org[mpdi.colormatched], fill=TRUE, lwd=0.1, resolution=0, projection="polyconic")
map("state", col = "black", fill=FALSE, add=TRUE, lwd=0.75, resolution=0, projection="polyconic")
title(main="Metropolitan Power Diffusion Index, Special Districts")
legend("bottomleft", legend=mpdi.legend, fill=plotclr.org, bty="n", cex=0.65)
Just a few lines of code and you get this.