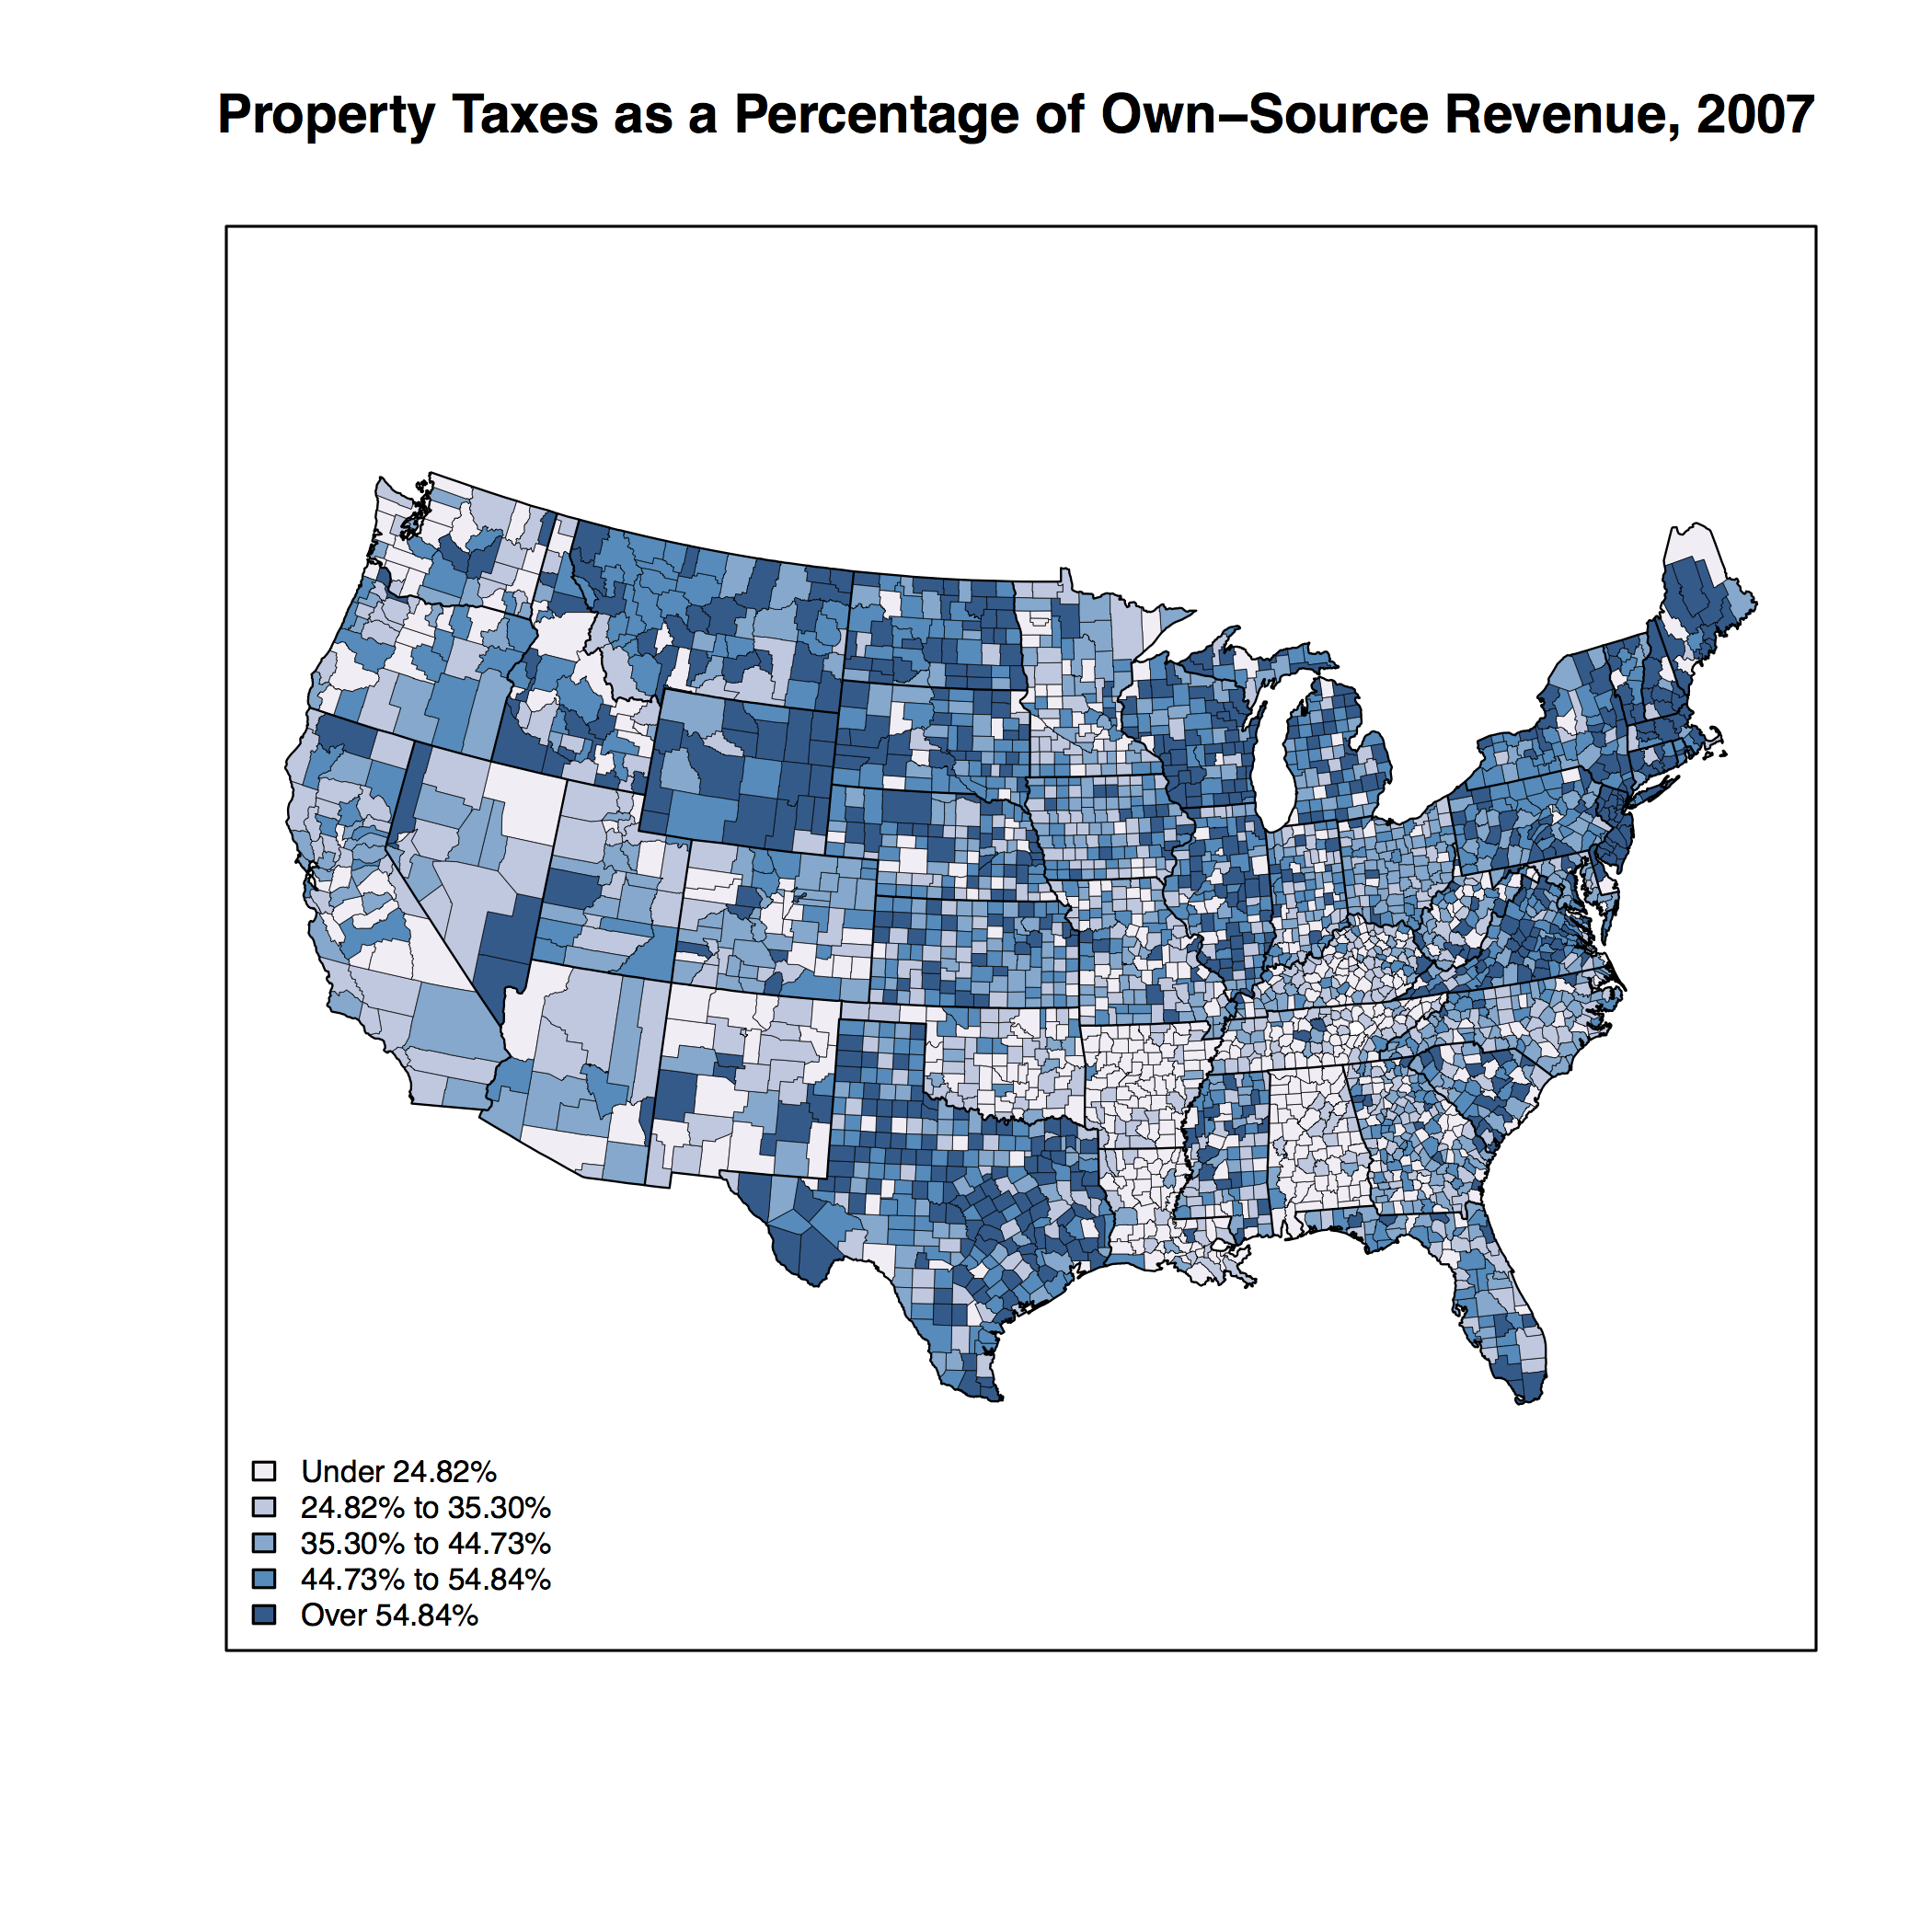
The property tax has a number of desirable properties. State and local governments have been using it in the U.S. forever, and it’s incredibly stable (up to a point, see 2008-2009). The tax is easy to administer at the local level. It can also be thought of as a benefits tax. Local control of the rate and the base enhances fiscal autonomy. Finally, the property tax is a highly visible and transparent form of taxation. While academics and policymakers see the virtues of the property tax, most taxpayers hate it and have pushed for ever increasing limits on the usage of the tax. Still, the tax remains an important revenue source for local governments. The spatial pattern of this reliance can be see in the first map below. The map shows property taxes as a percentage of own-source revenues in 2007 from the Census of Governments. Property tax reliance is measured at the county area level; an agglomeration of all the local governments in a county. Organizing the data in this way gives us a good idea of how the property tax is used across the country. Darker blues indicate more heavy usage. It is quite apparent there is some pattern to the usage of the property tax. It is popular in the northeast, upper midwest and plains, and in Texas. This pattern is at least partially the result of tax and expenditure limitations.
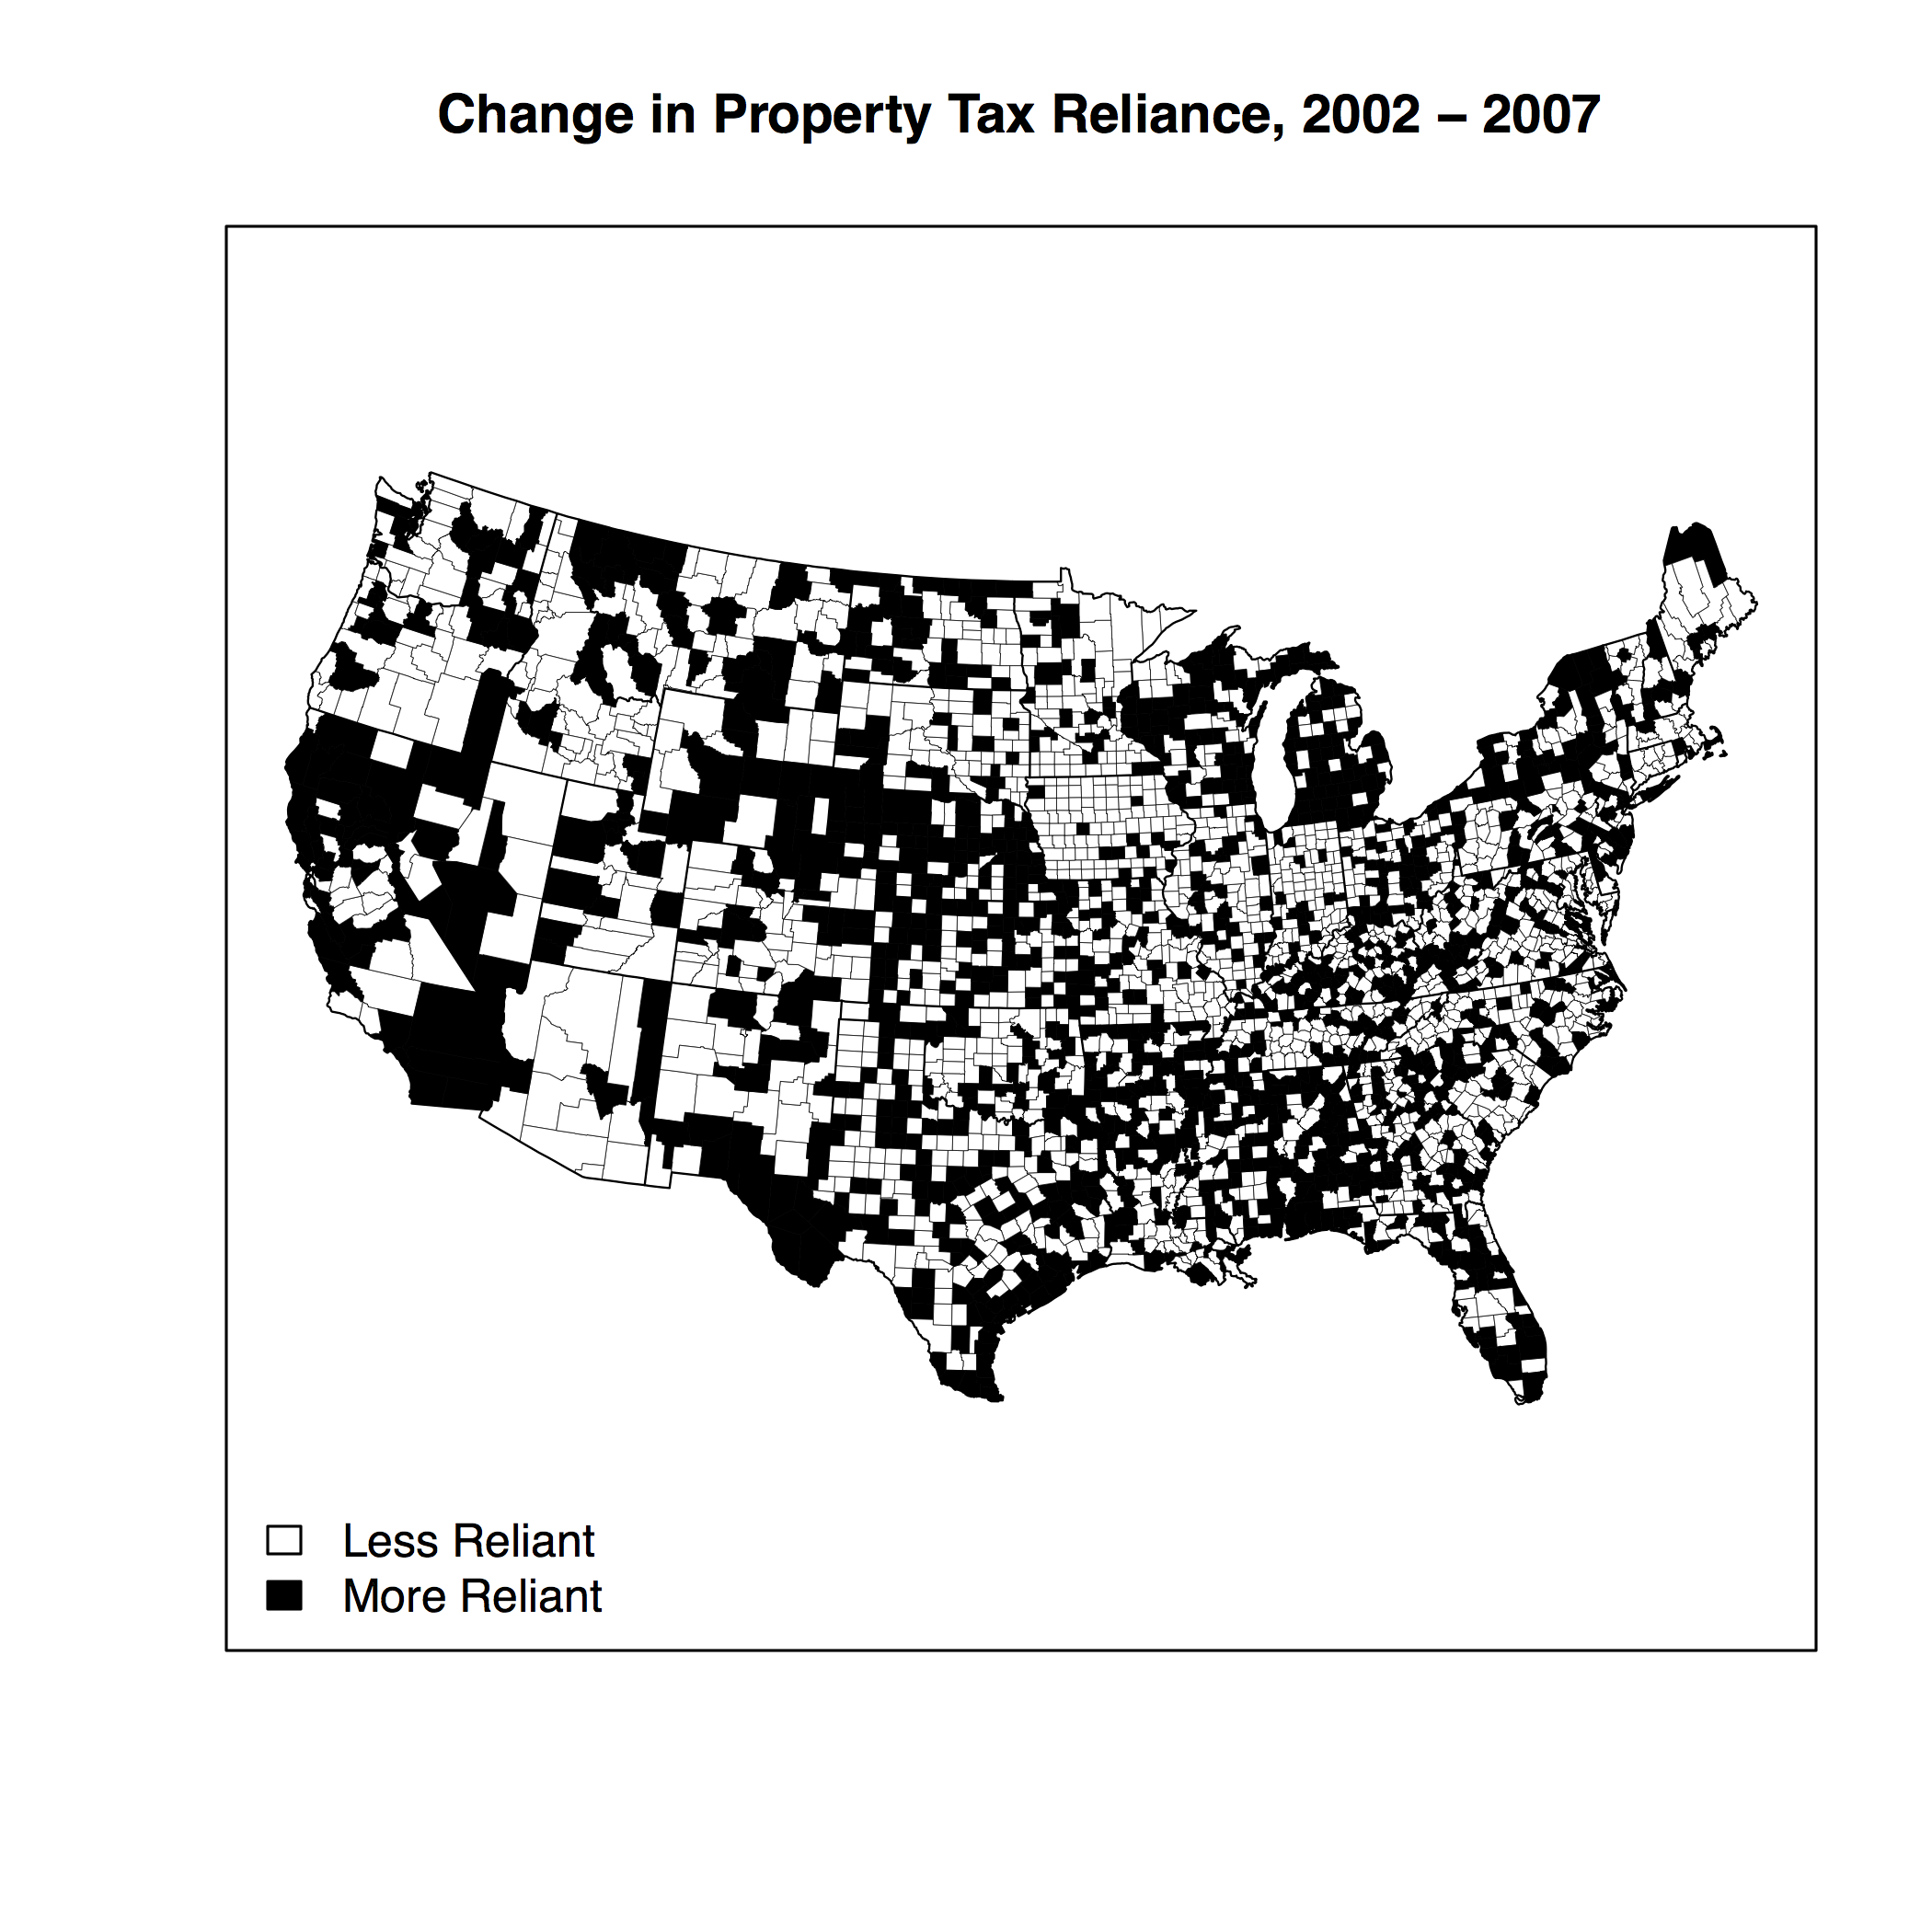
While the levels of usage give us one perspective, we might be more interested in changes over time. Data at this level of aggregation is only available every 5 years. Below we see the change from 2002 to 2007. Black colored counties show an increase in property tax reliance and white show a decrease. Unsurprisingly, a number of counties increased their usage. Housing was booming during this period and it is likely local policymakers couldn’t resist taking advantage of this to increase revenues. However, we cannot rule out that rates also increased.
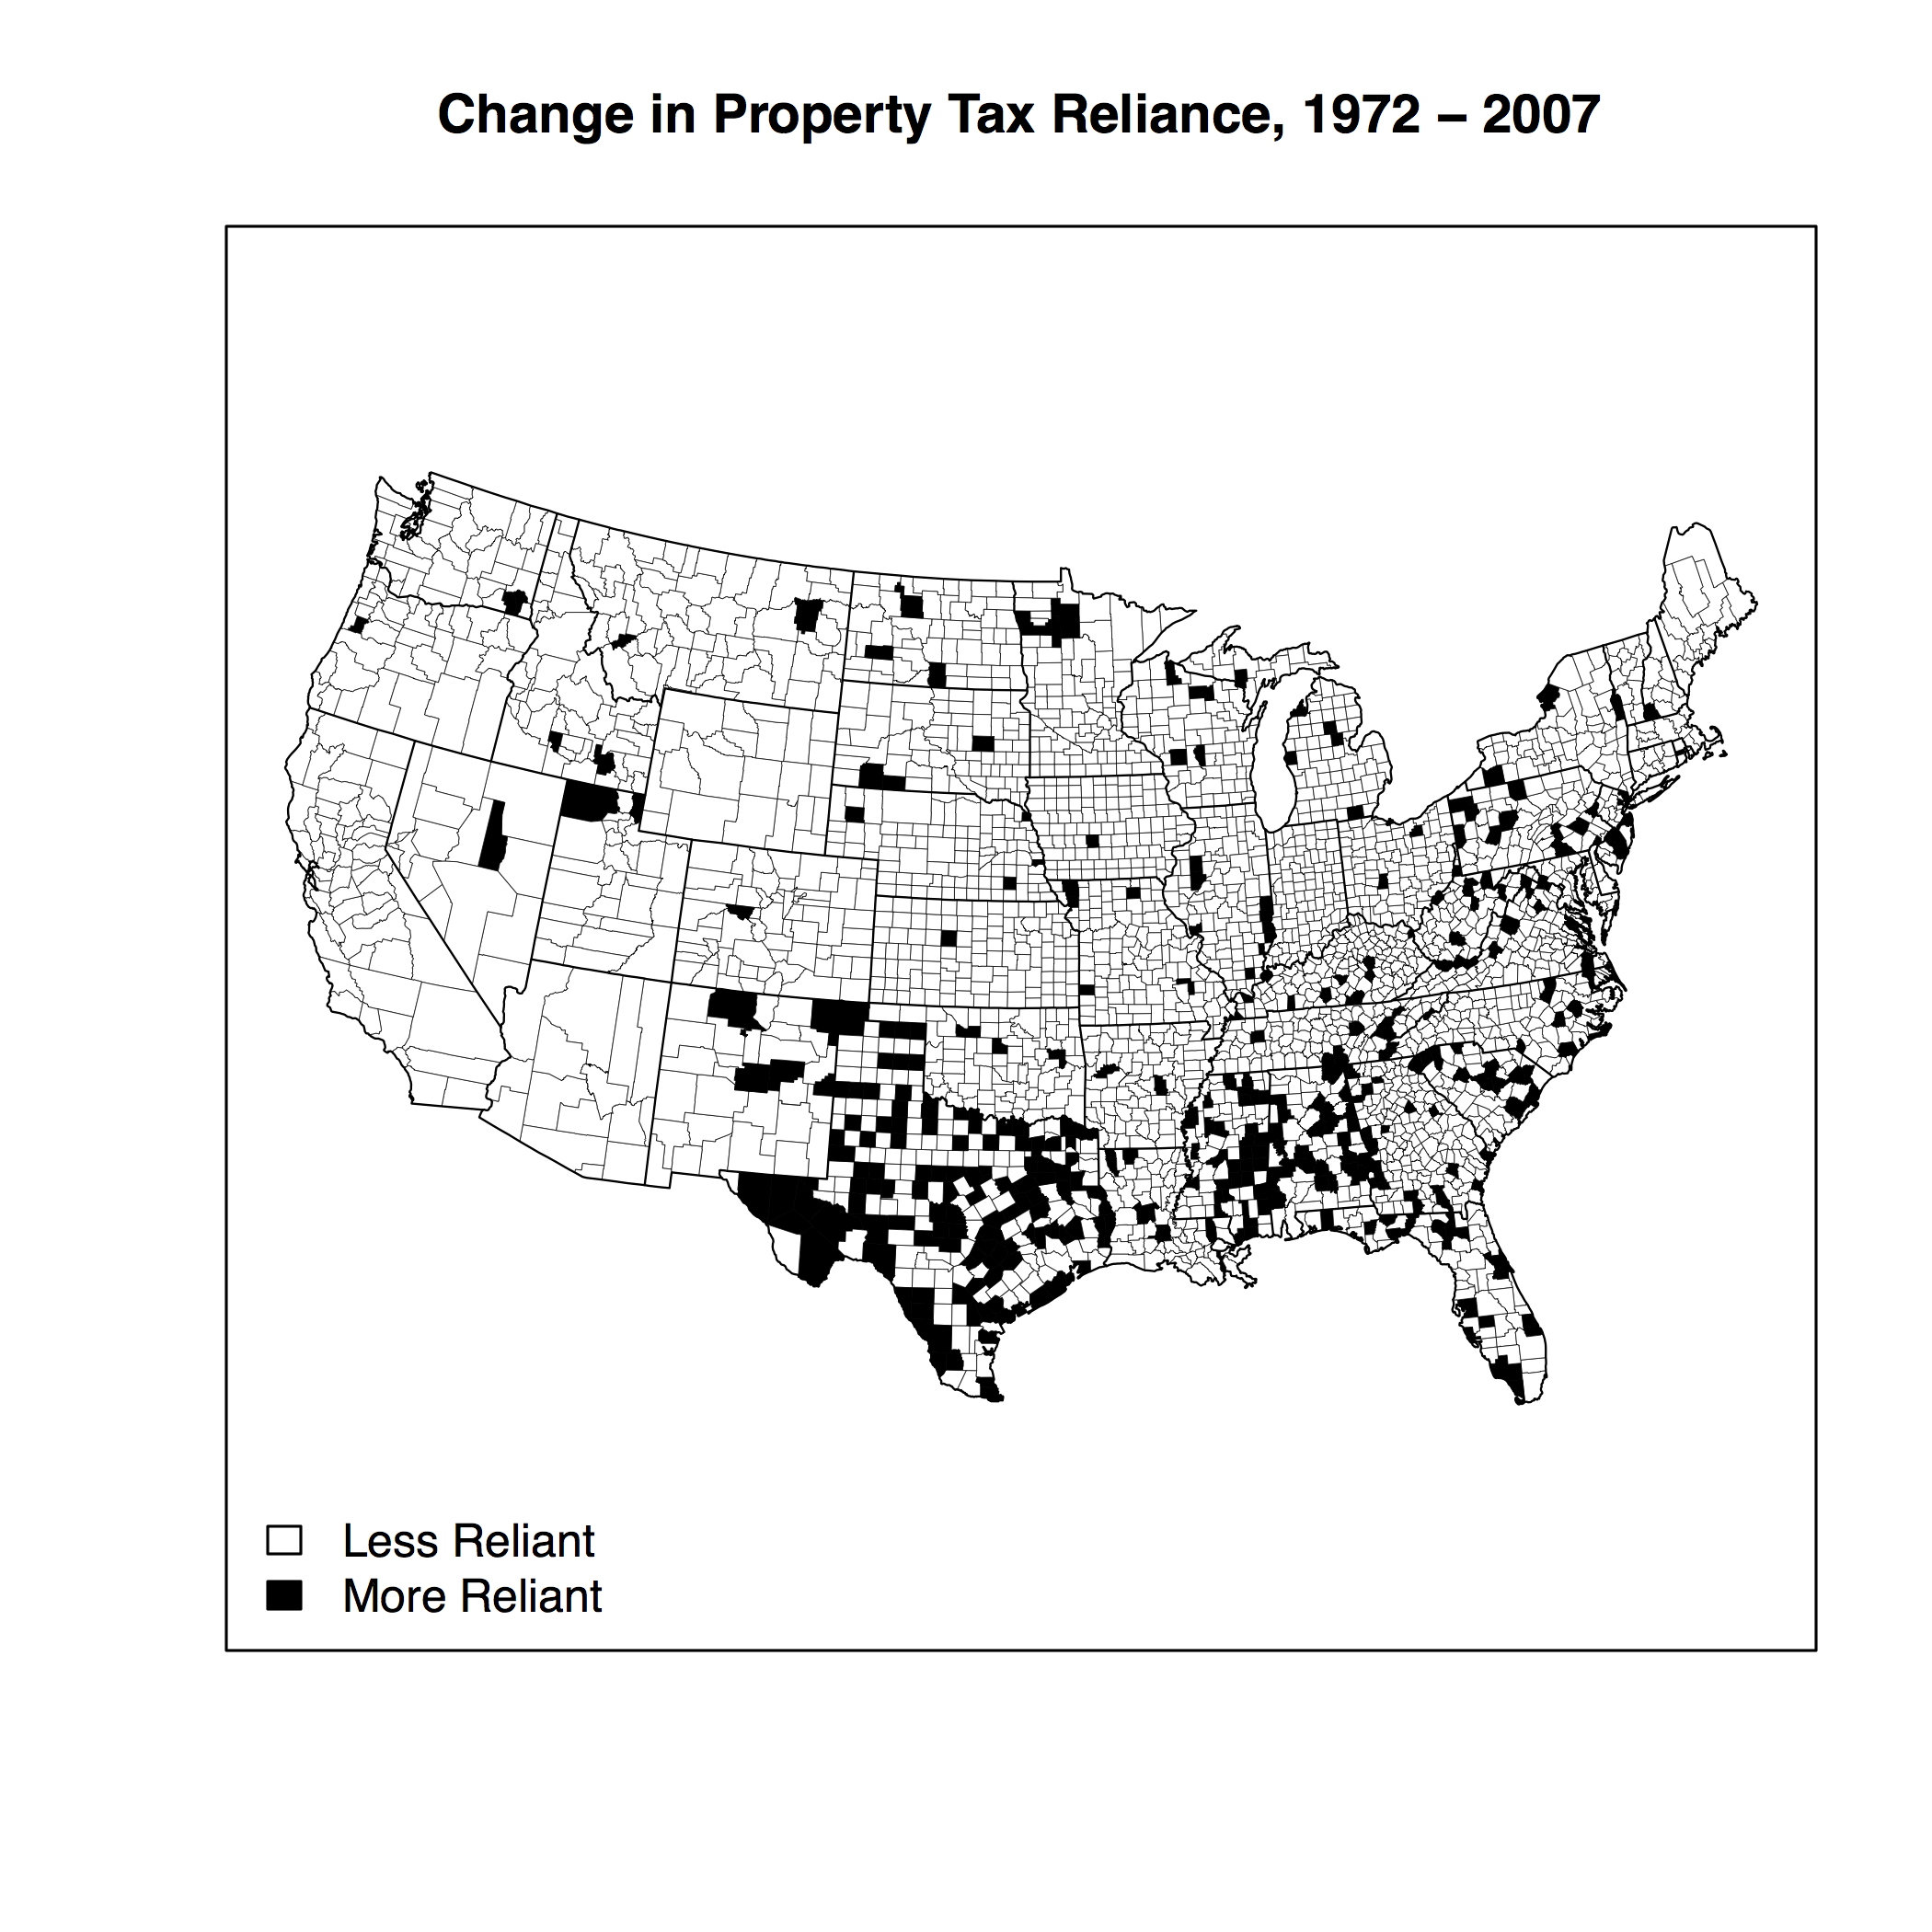
A one time period change doesn’t necessarily tell us how the usage of the tax has changed over the long term. To examine this, the change from 1972 to 2007 is shown in the map below. The same scale is used as the previous map. We see a much different trend here with a vast majority of counties decreasing their reliance on the property tax. Increases in reliance on the property tax are largely limited to Texas, Mississippi, and Alabama.
Despite its virtues, reliance on the property tax has declined. And where reliance has increased is spatially clustered in just a few states. What does all of this mean? Many local governments are turning away from an extremely stable and easy to administer revenue source to more volatile revenues (primarily local option sales taxes, where applicable, and user charges). Unfortunately, we will have to experience a few more recessions to fully understand if this potential volatility translates into significant issues for local governments.