
My last few posts have included a large number of maps to visualize the Census of Governments’ organizations data. Rather than using a full fledged GIS program like ArcGIS or QGIS, I made these maps using the statistical and graphics program R. There are a number of reasons for this decision, principally the need to create a large number of similar maps. Writing code to accomplish this task is a lot easier than making a number of identical maps by hand.
There are a number of methods for making maps in R. Rather than fooling with Shape Files, I decided to use library(maps). This makes mapmaking an easy process. Below is the code I utilized to draw these maps. This code creates the map found below the code (published in Local Governments in the United States, 2007 Edition).
library(maps)
library(RColorBrewer)
gid <- read.table("county area govs 2007.csv", header=TRUE, sep=",", stringsAsFactors=FALSE)
summary(gid)
data(county.fips)
attach(gid)
colors <- brewer.pal(5, "PuBu")
gid$colorBuckets <- as.numeric(cut(gid$total, c(0,25,50, 75,100,550)))
leg.txt <- c("1 - 25", "26 - 50", "51 - 75", "76 - 100", "> 100")
colormatched <- gid$colorBuckets [match(county.fips$fips, gid$co_fips)]
map("county", col=colors[colormatched], fill=TRUE, lty=0, resolution=0, projection="polyconic")
map("state", col="black", fill=FALSE, add=TRUE, lty=1, lwd=0.2, projection="polyconic")
title("Total Local Governments, 2007")
legend("bottomleft", leg.txt, bty="n", fill=colors)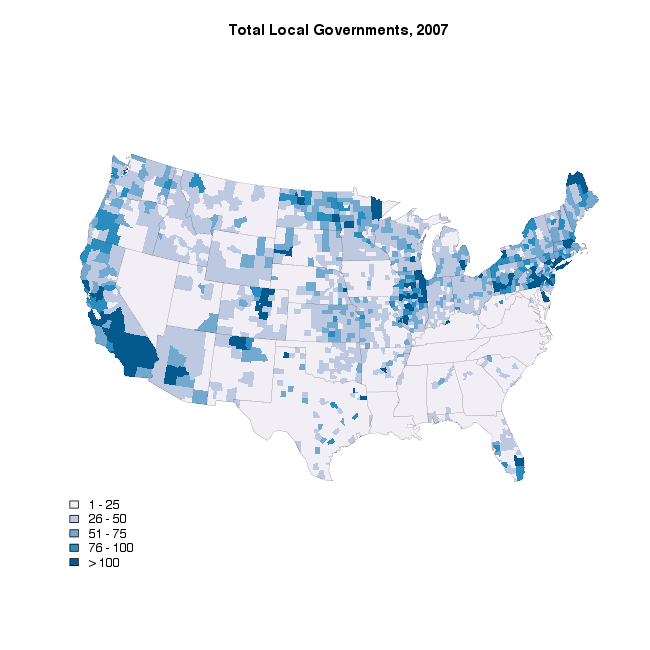
This method makes an attractive, print-ready map. It also makes making a number of similar maps dead simple. Enjoy!